An interesting Custom Software Integration Project to automate the addition of pins to a branded UK map by linking WordPress, Google sheets & Hubspot
When location data already exists inside operational systems, the most effective visual tools are often the ones that can draw from that data automatically rather than relying on manual updates. In this case, the client needed a way to turn CRM activity into a live, branded geographical interface. So some software integration was needed linking up multiple platforms.
Our client had a nationwide network of offices and staff and needed a way to display those locations accurately on a map of the UK.
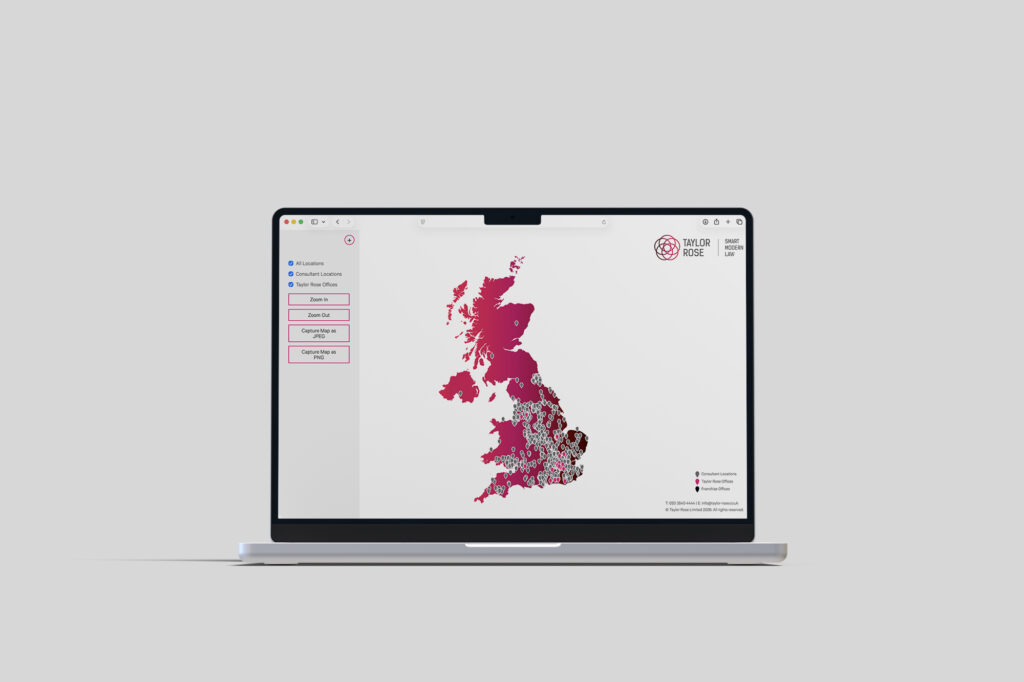
The requirement was broader than simply showing where offices were based. The map needed to place each location correctly using postcode and coordinate-based data, while also reflecting the company’s own branding, including its colour palette, styling and overall visual theme. A standard Google Maps embed was not suitable, because it would have introduced design limitations and a third-party visual layer that did not align with the rest of the business’s digital presence.
Alongside the presentation challenge, there was also a systems challenge.
The client did not want a map that someone had to maintain manually every time the business changed. They wanted the display to be driven by operational data already being created elsewhere in the organisation. Specifically, they wanted a new location pin to appear automatically when a deal reached a Won stage in the CRM pipeline, and for locations to be removed again when they were no longer active.
So the requirement was not just for a map, but for a location tool that combined geographic accuracy, brand control, automated data handling and minimal day-to-day administration.
Working from those needs, we helped design a lightweight, decoupled solution made up of three connected layers: HubSpot, Google Sheets and a custom WordPress-based map application hosted on a subdomain.
At the front end, the client needed something that felt like part of their own digital environment rather than a generic third-party mapping tool. To achieve that, we built a custom SVG map of the UK rather than relying on a standard map provider. This gave the client full visual control and made it possible to style the map precisely in line with the wider brand.
To support automation, Google Sheets was used as the structured data source behind the map. Each row represented an office record and contained the location data and related information needed to generate a pin. This worked well because the sheet acted as a simple intermediary layer between the CRM and the front-end display. Instead of making the map dependent on manual content entry inside WordPress, the client now had a live data table that could be updated automatically and read dynamically by the map logic.
The upstream trigger came from HubSpot.
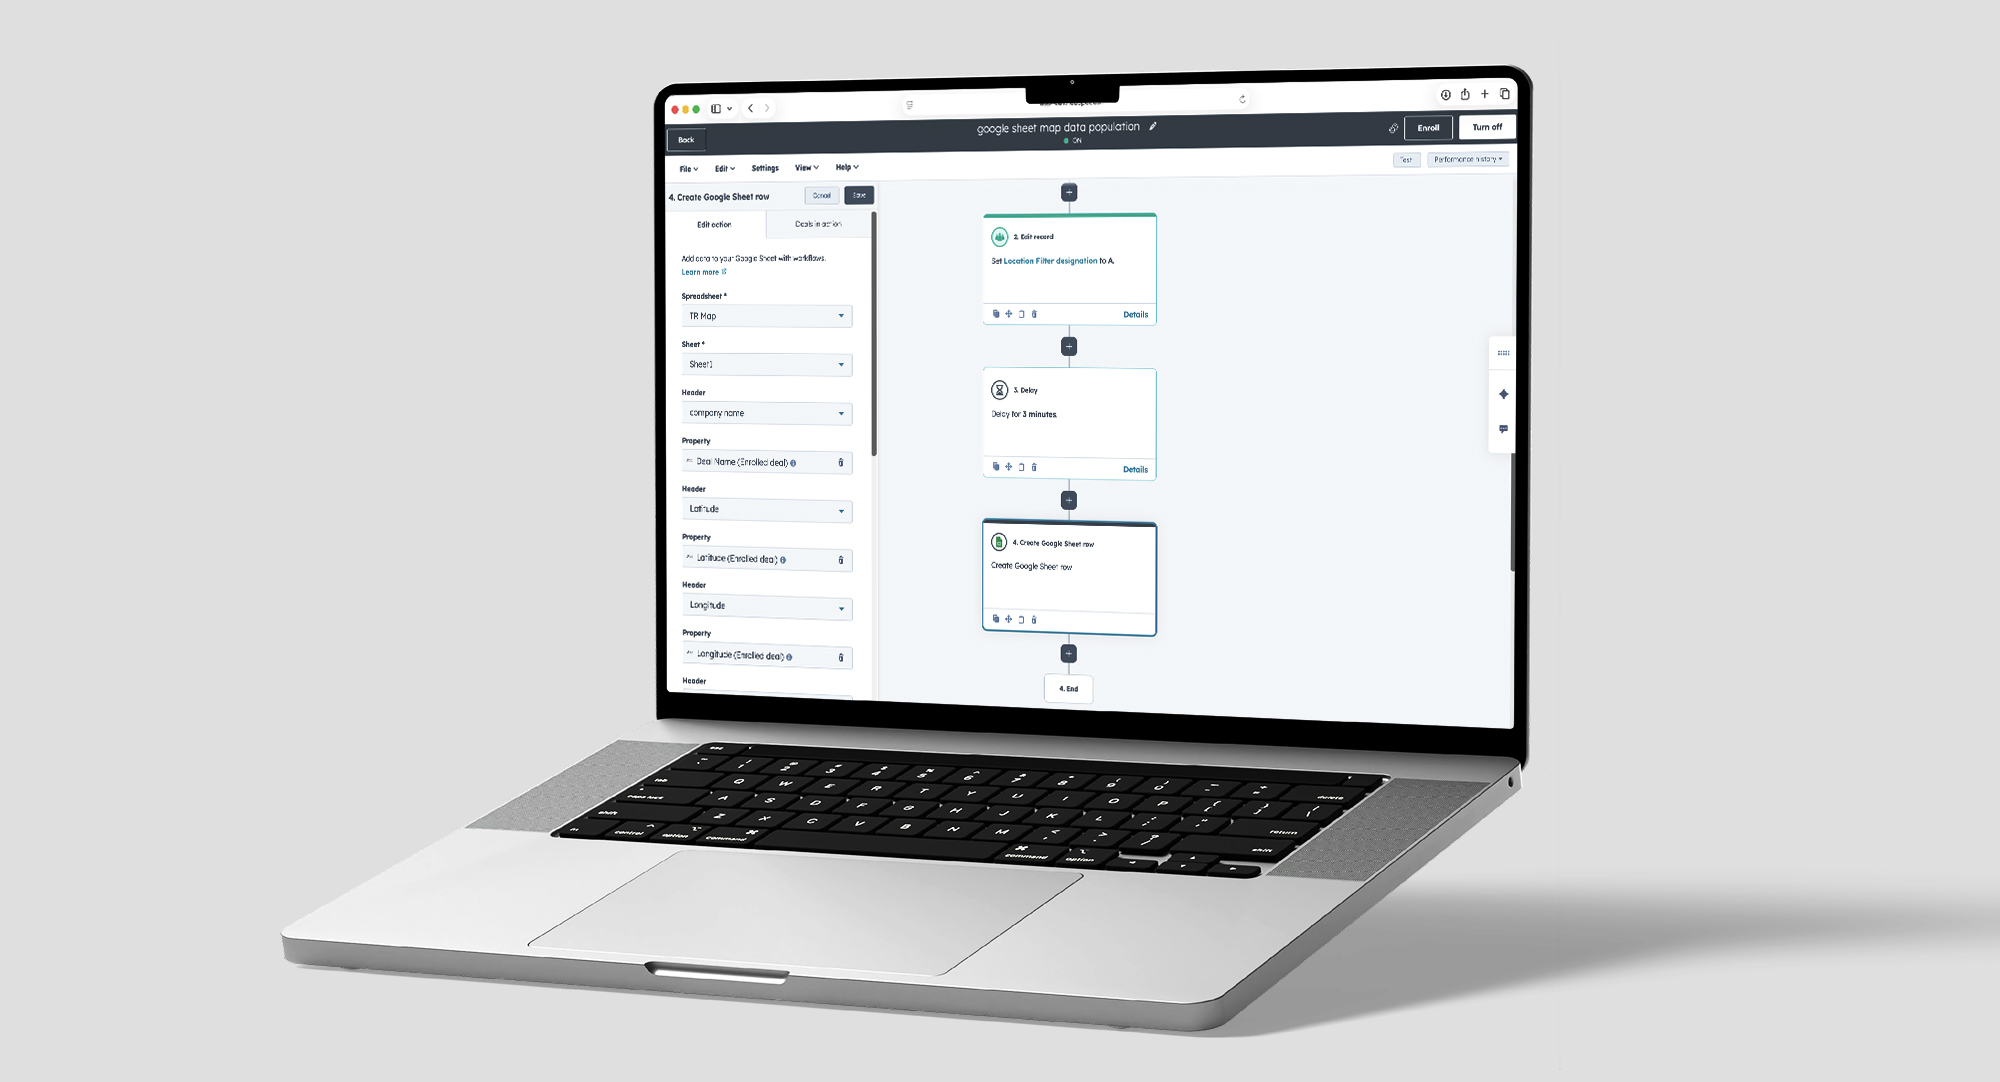
When a deal moved to the relevant stage in the pipeline, HubSpot automation pushed the required location data into the Google Sheet. Once the row had been created, the map logic picked up the new data and rendered a corresponding pin on the branded SVG map in the correct geographical position.
The process worked as follows:
A deal reaches the required stage in HubSpot
HubSpot automation writes the location data into Google Sheets
The map reads the updated sheet data
A new location pin is rendered automatically on the branded SVG map
The same logic was also used for removal. If a location was no longer active, the relevant record could be removed or marked inactive, and the corresponding pin would disappear from the map without anyone needing to manage the front-end display manually.
To keep the system clean and easy to maintain, the map application was deployed in a standalone WordPress installation on a subdomain. This gave the client a dedicated environment for the tool without interfering with the main website, while still allowing it to sit neatly within the wider digital setup.
Result
The end result was a fully automated, branded location tool that turned live CRM activity into a useful visual business asset.
From an operational point of view, the biggest gain was that the map no longer required manual management. New locations could be created automatically through the existing CRM workflow, and inactive ones could be removed just as cleanly. That reduced administration and lowered the risk of the map becoming outdated over time.
From a technical perspective, the solution also gave the client a clear separation of responsibilities:
HubSpot handled the business event trigger
Google Sheets acted as the live structured data layer
WordPress and SVG handled the branded visual presentation
That made the setup not only automated, but also modular and easy to understand.
From a brand perspective, the custom SVG approach created a much stronger result than a standard third-party map would have done. The client gained a location interface that felt like part of their own business rather than an embedded external tool.
The final outcome was a system that combined data automation, geographic accuracy and brand consistency in one seamless solution — giving the client a live office map that stayed current, looked right and required no ongoing front-end maintenance or no ongoing management. Thats the beauty of software integrations. It can save the company time and elevate the brand all at the same time.